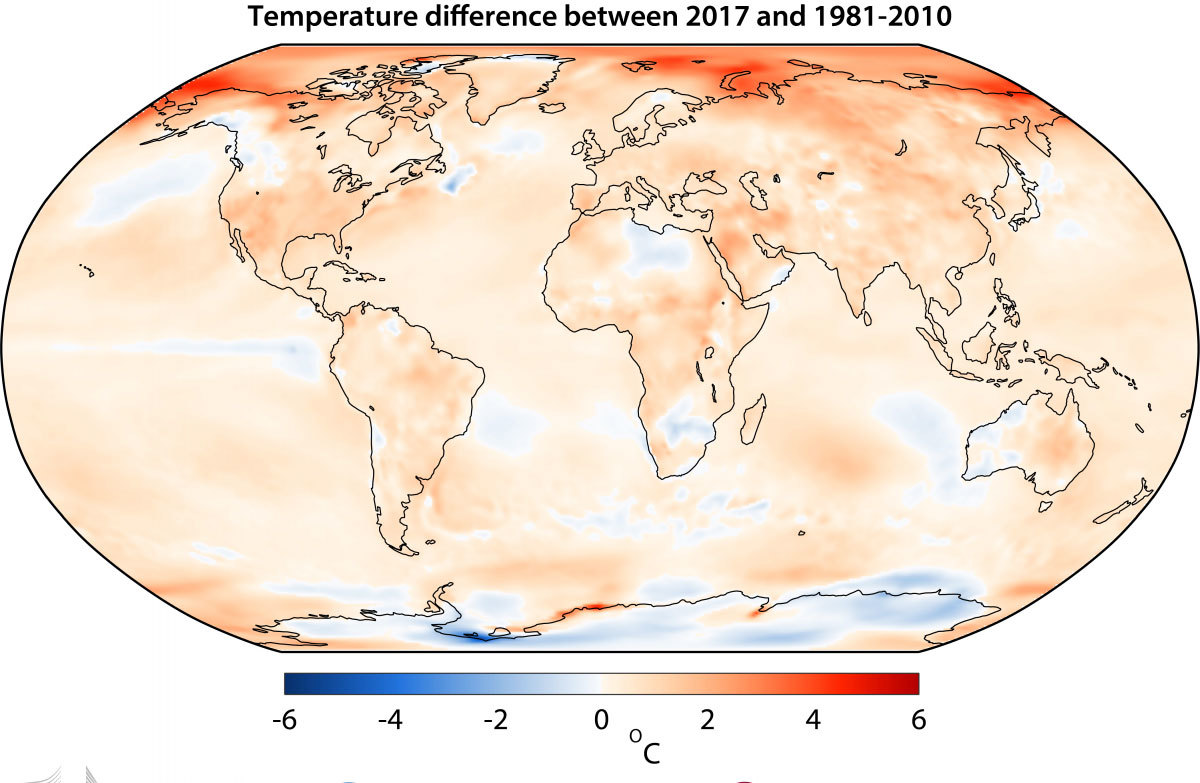
Air temperature at a height of two meters for 2017, shown relative to its 1981–2010 average. Copernicus Climate Change Service, ECMWF
Last year was the second hottest year on record worldwide, behind 2016, according to a European Union climate monitoring program. Global temperatures averaged 14.7 degrees Celsius (58.46°F) — 1.2 degrees C (2.2°F) above pre-industrial times.
The announcement comes from the Copernicus Climate Change Service (C3S), a research project by the European Union to provide past and current climate data to help inform EU climate policies. It is the first major weather or climate agency to report 2017’s final average temperatures, but the measurements back up a projection by the World Meteorological Organization (WMO) made in November that 2017 would be the second- or third-hottest year on record, according to Reuters.
C3S reported that last year was just 0.1 degrees C cooler than 2016, and 0.5 degrees C warmer than the 1981-2010 period.
While 2016’s temperatures were boosted by an intense El Niño event in the Pacific Ocean, C3S said that 2017 saw very little influence from that event. Rather, “2017 was close to the warmest year on record despite cooling La Niña conditions both early and late in the year,” the report said.
UPDATE, January 18, 2018: NASA scientists confirmed 2017 as the second warmest year since 1880, when global measurements first became possible and records began, while the National Oceanic and Atmospheric Administration (NOAA) concluded it was the third hottest year by a small margin.
The minor difference is due to the different methods used by the two agencies to analyze global temperatures, although the agencies’ records remain in strong agreement over the long term.
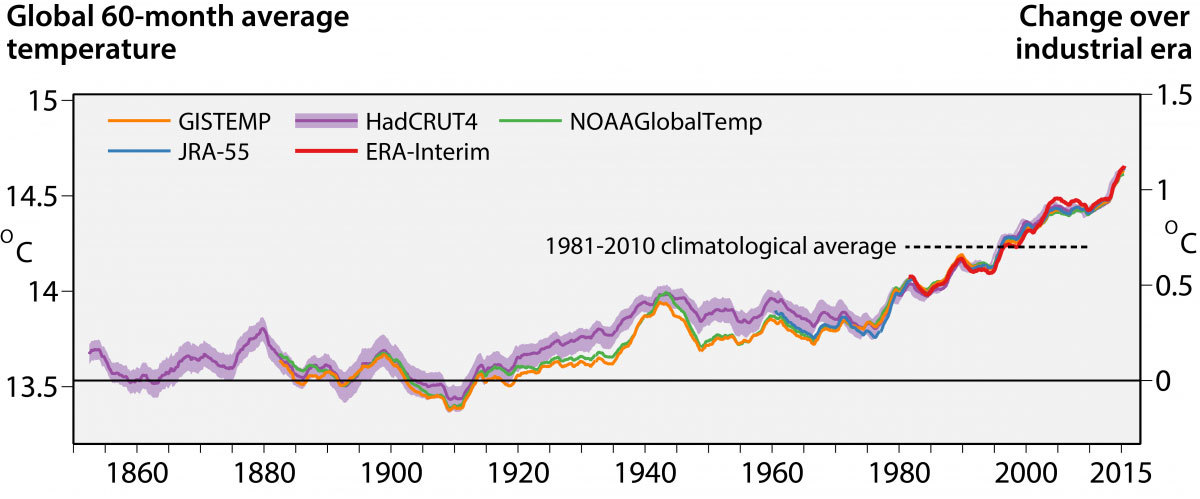
Running 60-month averages of global air temperature at a height of two meters (left-hand axis), and estimated change from the beginning of the industrial era (right-hand axis), according to different scientific datasets. C3S