Researchers have developed a new method for mapping global carbon emissions for individual cities on an
hourly basis — a major improvement over previous techniques, which quantified greenhouse emissions less accurately and at coarser scales, according to researchers at Arizona State University. The maps are derived from worldwide databases of population, power plants, and national fuel use statistics, and they encompass 15 years of data. Among other findings, the analysis revealed increased emissions in China, India, Europe, and the northern U.S. in 2010, after the peak of the global financial crisis. The researchers say this reflects faster recoveries from the crisis in those regions compared to, for example, the southeastern U.S., where emissions lagged in 2010. The results of the analysis match ground-level measurements, confirming the accuracy of the maps, the researchers say.
Click to Enlarge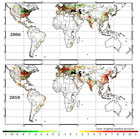
Emissions before and after financial crisis