A team of U.S. researchers has developed a software system that they say documents carbon dioxide emissions in urban areas down to the level of individual buildings or street segments. Using publicly available
data on local pollution, traffic counts, and building uses — as well as models of building-by-building energy consumption — the researchers from Arizona State and Purdue universities were able to create three-dimensional maps detailing carbon emissions. The researchers hope the software will provide insights into urban CO2 sources and help guide public policy on climate change and sustainable energy use. “Cities have had little information with which to guide reductions in greenhouse gas emissions — and you can’t reduce what you can’t measure,” said Kevin Gurney, an assistant professor at Arizona State University. So far, the so-called Hestia software has been used to produce visualizations for the city of Indianapolis, but the group is also developing maps for Los Angeles and Phoenix.
Click to enlarge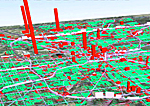
Bedrich Benes and Michel Abdul-Massih
Annual carbon emissions, Indianapolis