The most striking visualizations to date of Hurricane Sandy, which devastated parts of the U.S. East Coast last year, show in great detail the storm’s evolution and path. Developed using state-of-the-art computer models
at the National Center for Atmospheric Research (NCAR), the images are based on data with spatial resolution 5,500 times greater than NOAA’s highest-resolution hurricane forecast model. The visualizations show how several well-studied weather phenomena coincided to create the superstorm. They also show how, about a day before it made landfall, cool air began to envelop the storm’s warm core. This ultimately tempered Sandy’s power, but it also could have intensified winds at the storm’s lower levels. The computer model includes 150 layers of vertical data, which means the model calculated weather conditions at more than 4 billion points within the storm each second, said meteorologist Robert Henson of the University Corporation for Atmospheric Research, which manages NCAR.
Click to Enlarge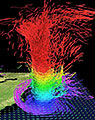
Mel Shapiro, NCAR
Temperature model of Sandy