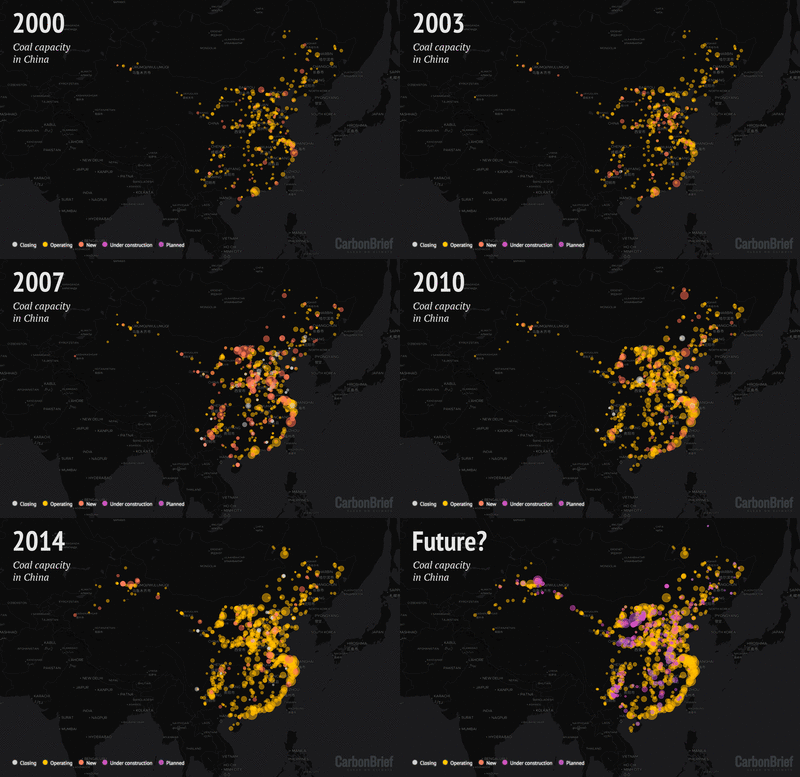
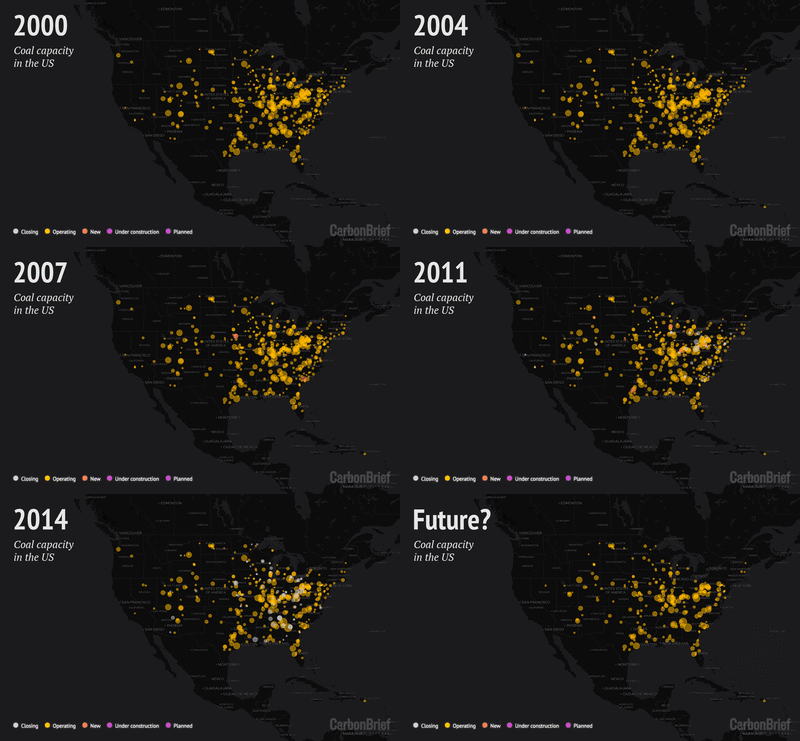
Click to enlarge. Carbon Brief
The world has doubled its coal-fired power capacity since 2000, largely due to rapid growth in China and India. There are now 2,000 gigawatts of coal-fired generating capacity, with another 200 GW currently being built and 450 GW planned, according to a new interactive map that visualizes the global coal trends in the 21st century.
The map, created by the UK-based climate and energy data group Carbon Brief, shows the location of every planned, under construction, operating, and retiring coal-fired power plant from 2000 to 2017. The new map, which uses data from CoalSwarm’s Global Coal Plant Tracker, allows users to examine coal trends at a hyperlocal level, with search capability down to a zip code.
It shows that China’s coal capacity has quintupled in the 21st century, reaching 935 GW in 2017, nearly half of the world’s total capacity. Since 2000, India has had the second-fastest rate of coal growth, with its capacity tripling to 215 GW.
But in recent years, coal’s rapid growth has slowed, and plants are being retired at faster rates as cheaper natural gas and renewables shift energy markets. CO2 emissions generated by coal peaked globally in 2014. Since then, plants with 200 GW of capacity have been retired in the European Union and the United States; another 170 GW is set to be retired by 2030. In 2017, just six new coal plants were completed globally, down from 273 in 2006. Since 2010, only 34 percent of planned coal capacity has actually been built or is under construction.
To explore the map and examine global coal trends, click here.


