A 15-second NASA animation shows the steady and rapid warming of the planet since the middle of the 20th century, with regions in the Arctic and Siberia warming as much as 2 to 4 degrees C (3.6 to 7. 2 degrees
F) above a long-term average. The animation begins in 1950, but the intensity of the yellow, orange, and red colors shows how much temperatures have increased compared to baseline temperature data collected from 1880 to the present. NASA said that nine of the planet’s 10 warmest years have occurred since 2000, and worldwide surface temperatures continued to rise in 2013, according to satellite and meteorological data. Since 1880, when atmospheric concentrations of CO2 were 285 parts per million (ppm), the average global temperature has risen 1.4 degrees F; atmospheric CO2 concentrations crossed a milestone of 400 ppm last year. “Long-term trends in surface temperatures are unusual and 2013 adds to the evidence for ongoing climate change,” NASA scientist Gavin Schmidt said.
View Animation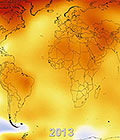
Temperatures show long-term increases.