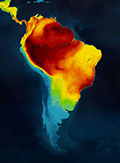
U.S. researchers have published a series of data-rich maps that identify the world’s conservation priority hotspots with a level of detail they say is 100 times finer than previous assessments. Using the latest data on more than 21,000 species of mammals, amphibians, and birds, the maps produced by North Carolina State University researchers provide a snapshot of biodiversity health at a 10-kilometer-by-10-kilometer scale, comparable to the geographic scale at which critical conservation decisions are made. The color-coded maps reveal patterns of biodiversity for the different types of species. Researchers hope the information will help policymakers make best use of scarce conservation resources to protect the world’s most vulnerable species. The paper was published in the Proceedings of the National Academy of Sciences.

Saving Species/Globaïa
Density of biodiversity, South America