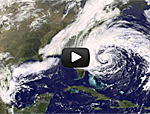
As the storm that was Hurricane Sandy weakened over Pennsylvania, NASA released a timelapse animation of the lifespan of the massive storm, tracking its path from the Caribbean, where it developed, to its violent landfall on the mid-Atlantic coast of the U.S. The collection of images, taken by the NASA GOES-13 satellite from Oct. 23 to Oct. 31, illustrates the storm gaining intensity as it traveled north, at times reaching nearly 1,000 miles in width. When the storm reached the mid-Atlantic on Oct. 29, it became wedged between a cold front over the Appalachian Mountains and a high-pressure air mass over maritime Canada, preventing it from moving north or east and instead driving it ashore. At that point Sandy became a Nor’easter, triggering historic storm surges in coastal areas of New York and New Jersey and blizzard conditions in the mountain regions. Meteorologists say the swath of high winds produced by Sandy while it was a hurricane covered nearly 2 million square miles.
Timelapse of Hurricane Sandy Shows Birth and Death of Historic Storm
More From E360
-
Climate
How Climate Risks Are Putting Home Insurance Out of Reach
-
INTERVIEW
Inside the Plastics Industry Playbook: Delay, Deny, and Distract
-
Biodiversity
Freeing Captive Bears from Armenia’s Backyards and Basements
-
Food & Agriculture
In Indonesia’s Rainforest, a Mega-Farm Project Is Plowing Ahead
-
FILM CONTEST WINNER
In the Yucatan, the High Cost of a Boom in Factory Hog Farms
-
INTERVIEW
In the Transition to Renewable Energy, China Is at a Crossroads
-
E360 Film Contest
In India, a Young Poacher Evolves into a Committed Conservationist
-
E360 Film Contest
The Amazon Rainforest Approaches a Point of No Return
-
Biodiversity
Shrinking Cod: How Humans Are Impacting the Evolution of Species
-
Cities
‘Sponge City’: Copenhagen Adapts to a Wetter Future
-
INTERVIEW
On Controlling Fire, New Lessons from a Deep Indigenous Past
-
Solutions
Paying the People: Liberia’s Novel Plan to Save Its Forests
