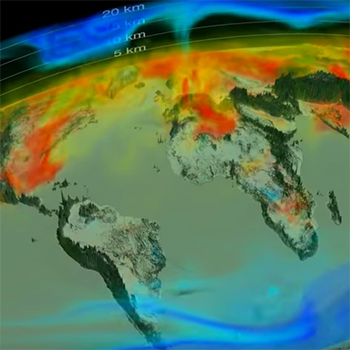
Scientists at NASA have created a striking new video animation that shows exactly how carbon dioxide moves through the atmosphere
 and across the globe — helping better explain how much CO2 stays in the atmosphere after being emitted, how long it stays there, and where it goes. That information, said NASA carbon cycle scientist Lesley Ott, will help improve researchers’ understanding of future climate change. The new 3-D visualization uses more than 100,000 measurements of CO2 taken daily from September 2014 to September 2015. It shows the rise and fall of CO2 throughout the seasons, the influence of geological structures like mountains, and the impact of highly productive ecosystems like the corn belt in the U.S. “There’s still a long way to go, but this is a really important and necessary step in that chain of discoveries about carbon dioxide,” said Ott.

The movement of CO2 across the globe.